Query History & Snippets
SoftDB automatically records every query you run and lets you save the ones worth keeping as named snippets. Both live in the History & Snippets drawer, which slides in from the right side of the SQL Editor.
Query History
Section titled “Query History”How history works
Section titled “How history works”Every time you execute a query — whether it succeeds, fails, or modifies data — SoftDB saves it to a per-connection history log. History is stored locally and persists across sessions. The maximum number of entries is controlled by the Max History setting in Preferences.
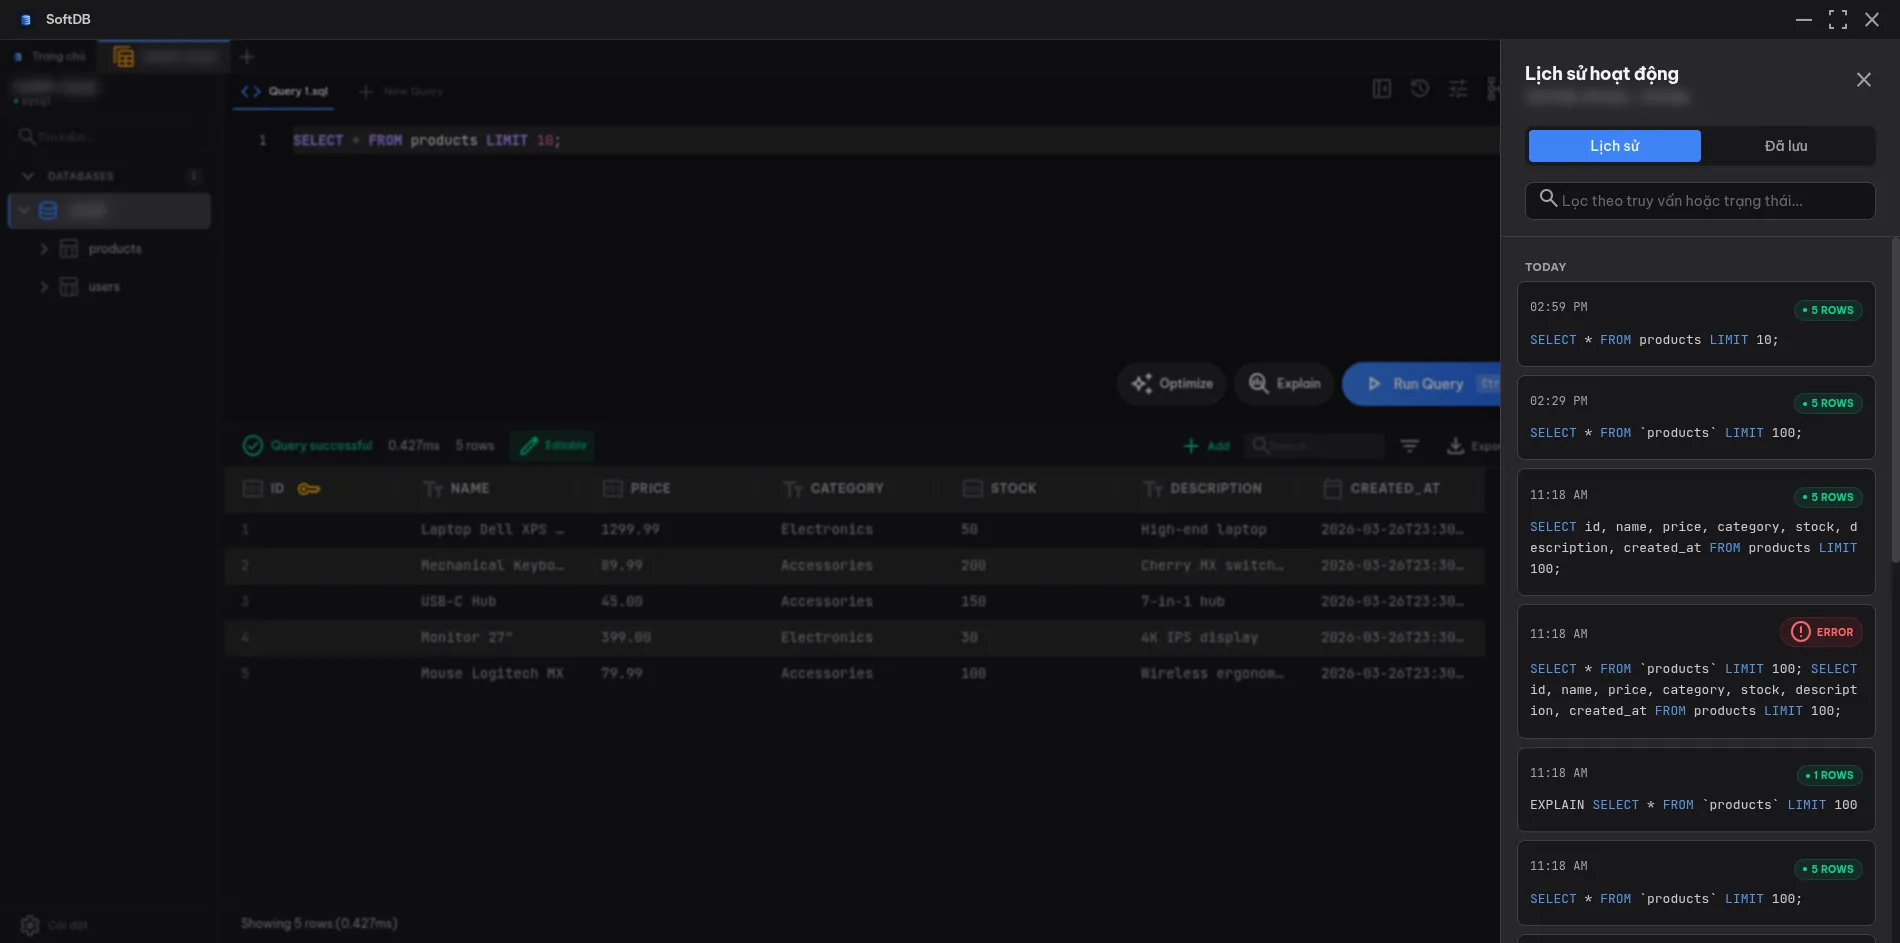
Each entry shows:
- The query text (truncated for long queries, expandable on hover)
- Execution status:
success,error, ormutation - Execution time and rows affected
Entries are grouped by date: Today, Yesterday, and older dates, so you can quickly find something you ran earlier this week.
Searching history
Section titled “Searching history”The search box at the top of the drawer filters entries in real time. It matches against both the query text and the status label, so you can type error to find failed queries or DROP to find destructive operations.
Re-executing a query
Section titled “Re-executing a query”Click the Use button on any history entry to load that query back into the SQL Editor. The drawer closes automatically and the editor is ready to run.
You can also click Copy to copy the query to your clipboard without loading it into the editor.
Saving from history
Section titled “Saving from history”Each history entry has a Save button (bookmark icon). Clicking it creates a quick snippet with an auto-generated title based on the query’s leading operation and table name. If the query is already saved, the button changes to Unsave and clicking it deletes the snippet.
Snippets
Section titled “Snippets”Snippets are named, reusable queries you save intentionally. They’re more than bookmarks — you can organize them into folders, tag them, mark favorites, and scope them to a single connection or share them globally across all connections.
Creating a snippet
Section titled “Creating a snippet”There are three ways to create a snippet:
- From history — click Save on any history entry for a one-click save with an auto-generated title
- From the editor — press Ctrl+S (or Cmd+S on macOS) while in the SQL Editor to open the snippet editor pre-filled with the current query
- Manually — switch to the Saved tab in the drawer and click + New Snippet at the bottom
The snippet editor has fields for:
- Title — a short, descriptive name
- Query — the SQL text (editable)
- Folder — an optional path like
reports/monthlyto organize snippets into groups - Tags — comma-separated labels for filtering, e.g.
analytics, slow-queries - Scope — connection-scoped (only visible for this connection) or global (visible from any connection)
Connection-scoped vs. global snippets
Section titled “Connection-scoped vs. global snippets”Connection snippets are tied to the connection they were created in. They’re ideal for queries that reference database-specific tables or schemas.
Global snippets are available from every connection. Use them for utility queries that work across databases, like SELECT version() or common diagnostic patterns.
The scope filter dropdown in the Saved tab lets you show All, Connection, or Global snippets.
Favorites and tags
Section titled “Favorites and tags”Star any snippet to mark it as a favorite. The star button in the drawer header toggles a Favorites only filter so you can quickly surface your most-used queries.
Tags appear on each snippet card and are searchable. The search box in the drawer matches against title, query text, folder path, scope, and tags simultaneously.
Managing snippets
Section titled “Managing snippets”Each snippet card has three action buttons:
- Use — loads the query into the SQL Editor
- Copy — copies the query to clipboard
- Edit (pencil icon) — opens the snippet editor to rename, retag, or change scope
- Delete (trash icon) — prompts for confirmation before deleting
Organizing with folders
Section titled “Organizing with folders”Folder paths use forward slashes as separators. For example, setting the folder to reports/monthly nests the snippet under a monthly subfolder inside reports. You can filter the snippet list by typing a folder path into the Folder path input in the Saved tab header.
Folders aren’t created explicitly — they exist as long as at least one snippet references them.